NAV Unveiled: How I Maximise my Investment Income


Understanding Investment Income
Net Asset Value Explained
Right, let's get cosy with Net Asset Value, or NAV as it's fondly known around here! This is a biggie in the investment world, especially if you're keen on squeezing the most income out of your investments. NAV is the fancy term for what each bit of the pie—an investment fund, that is—is worth. You figure it out by taking everything the fund owns, subtracting whatever it owes, and then splitting that number by the shares hanging around. It's like cutting cake but with less icing and more math. This little number doesn’t sit still, oh no! It dances around changing every day based on the market craze (Investopedia).
So why’s this NAV thing so important, especially with mutual funds? Well, it tells us what the slice is priced at today. It’s the street value per share, shedding light on what chunk of wealth you've nabbed with your pennies.
Calculating NAV
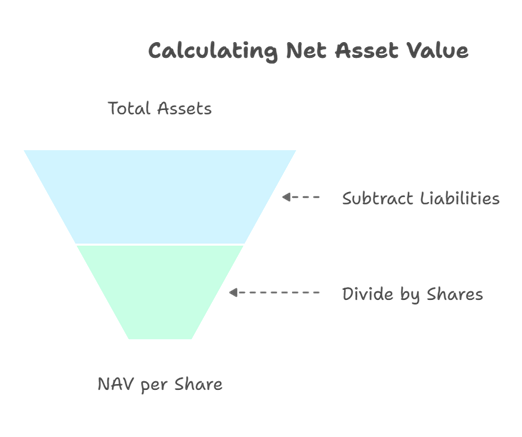
No need to bring out the abacus here; working out NAV is pretty straight-forward if you’ve got your numbers lined up. Here’s the magic formula:
{{NAV} = {Total Assets} – {Total Liabilities} Divided by {Number of Outstanding Shares}}
Let's put it into simple terms with a quick example:
- Total Assets: Picture it as the treasure chest holding all securities and cash.
- Total Liabilities: Think of it as the IOUs sitting on the treasure chest.
- Number of Outstanding Shares: These are the little certificates that say ‘I've got a piece of this’.
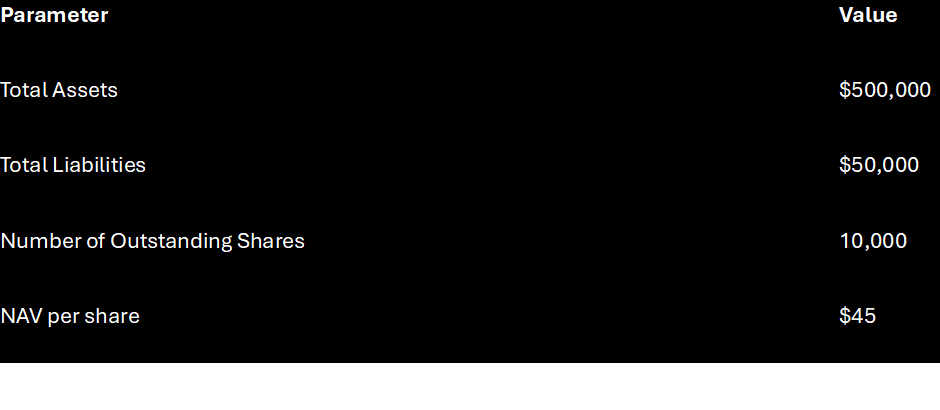
Say there’s a mutual fund with these digits:
- Total Assets: $500,000
- Total Liabilities: $50,000
- Number of Outstanding Shares: 10,000
Pop those numbers into the formula: {NAV} = {$500,000 - $50,000} divided by {10,000} = $45
And just like that, each share in this fund is priced at £45. Of course, this’ll shuffle around a bit each day as the fund’s finances jiggle. If you want to crunch more numbers, have a peek at our detailed info on NAV calculation.
In short, knowing your NAV juggle is vital for any savvy investor looking to plump up income streams. It gives a no-nonsense look at what your share in the market is worth, steering you clear of dodgy investment decisions.
For the nosy ones keen on upping their investment game, see how NAV can weave into your strategies in our chat about dividend yield, monthly dosh, and income party.
Importance of NAV in Investments
NAV for Mutual Funds
When you're diving into the world of mutual funds, net asset value (NAV) becomes your best bud. You see, NAV is all about pinpointing the value per share. Picture this: take the total of the mutual fund's assets, knock off its debts, and then spread it evenly among all the shares kicking about (Investopedia). Keep in mind, though, that what you actually pay for a share is the NAV with any extra fees tacked on, and when you're ready to cash out, you'd get the NAV minus those pesky fees.
So, how do they work out the price? Mutual funds check their NAVs after the U.S. stock markets say goodnight at 4 p.m. EST. Usually, they'd update the numbers between 4 p.m. and 6 p.m. EST (Investopedia).

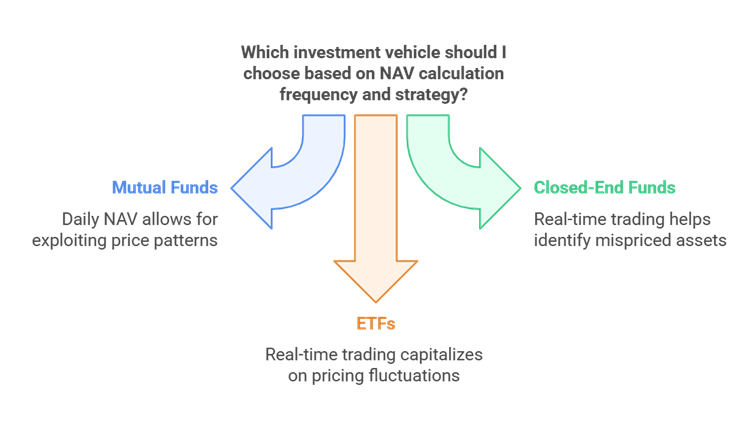
Open-end mutual funds are like diligent students—every trading day, they report their NAVs. These values change with portfolio shuffles and swinging share numbers (Investopedia).
NAV for Closed-End Funds
Now, closed-end funds are a bit of a different beast. They're more like your regular stocks, hanging out on the stock exchange. But here's the kicker—they might not always follow their NAV to the letter, which can open up some sweet trading moves for investors.
Sometimes these funds sell for more (a premium) or less (a discount) than their NAV, depending on who's buying and selling (Investopedia). So, if you're smart about it, you could scoop up shares for cheaper than they're worth and cash in when the market straightens things out.

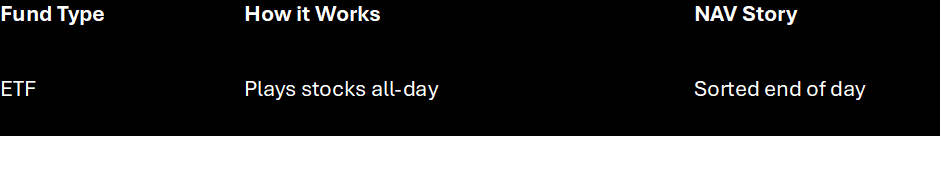
NAV for ETFs
Then you've got those trendy ETFs. Nets Asset Values apply here too, and knowing them ups your game in ETF land. They're like closed-end funds, chilling on stock exchanges, but with a twist—their trading value can be a bit different from their NAV, giving savvy folk like you something to work with.
ETFs like to follow an index or maybe a bundle of goodies, and they play the stock market game all day (Investopedia). At the end of the day, just like mutual funds, they get a NAV check-up, though the price can joystick around with market vibes.
If you're keen on actively managed ETFs, keep your eyes peeled on how the NAV stacks up against the market price. Knowing this means you'll make sharper investment calls.
Getting a handle on NAV can really set you up for growing your investment stash. By knowing how it fits into mutual funds, closed-end funds, and ETFs, you can whip up smart strategies for income building and keeping cash flowing. For more nifty tips, check out our takes on monthly income and dividend yield.
Evaluating Investment Performance
Alright, let's break down how to really make the most of those investment choices. When I'm sizing up how well my investments are doing, it's all about checking out the Net Asset Value (NAV) and comparing it with the total return. These two heavyweights together can really help me aim for the max when it comes to building up the old bank account. So, let's dig into what makes these metrics tick.
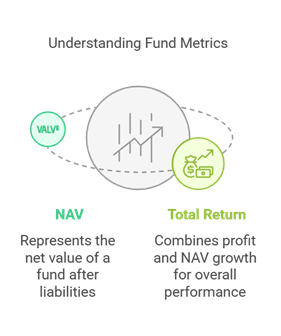
NAV vs. Total Return
Now, just staring at the NAV might have me missing the forest for the trees. It's kind of like measuring a cake just by its icing. NAV tells me the value per share of a fund, but it doesn't clue me into the tasty profits – in the form of dividends and capital gains – that are chopped off along the way. Those are crucial ingredients, and they all add up in the total return (Investopedia).
Assessing Fund Performance
To really get the lowdown on a fund's moves, both NAV and total return deserve a fair shake. Let's see how:
- Time Machine Needed: I need to track those NAV ups and downs over a good stretch of time. Comparing it from start to finish within, say, a year gives me a glimpse, but it might skip over the meaty payouts.
- Mind the Payouts: Income and capital gains payouts will nip at the NAV but are an integral part of the total return. I’ve got to account for these when totalling the score.
- Rely on Total Return: This is the ninja tactic – it rolls changes in NAV and socks in the payouts I might reinvest throughout that time period (Investopedia).
Check out this simple comparison:
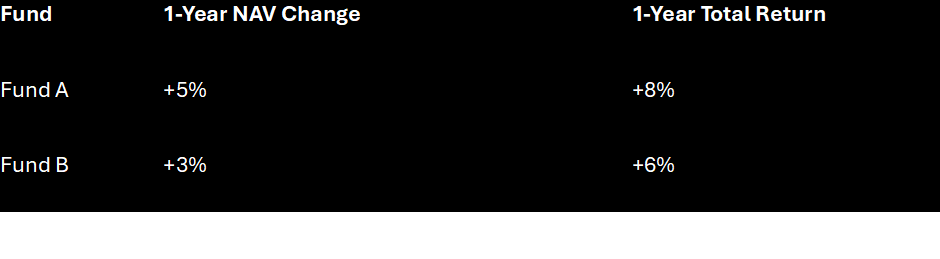
With the real deal, like above, Fund A's NAV plodded along at 5%, but the total return shot up to 8% thanks to some juicy pupil-popping distributions.
Grasping these metrics and what they mean for my income plans can signal me to finetune my strategy.
Sure! Let's spice up this chat about NAV and dive into what makes those fund numbers tick.
Factors Influencing NAV
Getting a grip on what gives the Net Asset Value (NAV) a nudge can make a big difference in how much you get from your investments. Let's chat about how valuing securities and keeping tabs on liabilities can move that NAV needle.
Securities Valuation
The NAV in any fund couldn’t move an inch without the value of the stuff it owns—like stocks, bonds, and a whole bunch of other financial goodies. Mostly, they're priced by what the market says. This means that when the market’s feeling generous, the value of those securities can shoot up. Picture this: mutual funds often use the end-of-day prices to figure out what these assets are worth (Investopedia).
Let's make it easy with a quick look at how this valuation plays out:
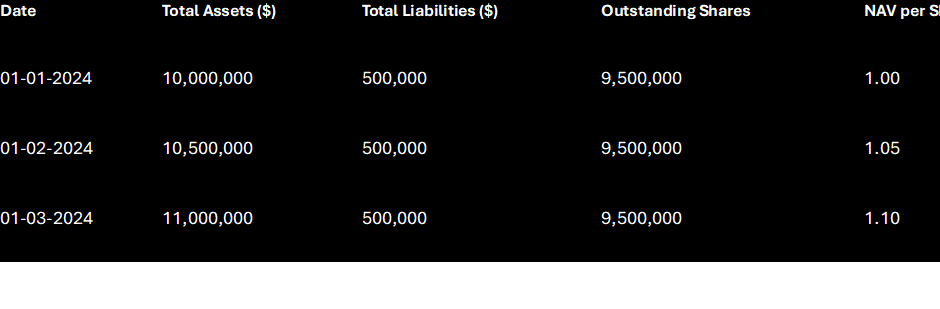
See what's happening? As the value of assets hops on up thanks to market movements, so does the NAV per share. It’s like magic, just mathematically engineered.
Liabilities Impact
Don’t underestimate the power of what the fund owes. Expenses like management fees or admin costs take a chunk out of NAV. They're the pesky little gremlins that subtract from the total assets when calculating NAV (Investopedia).
Your assets might be having a party, but if your liabilities crash it, they could spoil all the fun. Keeping those liabilities tamed boosts the NAV. Here, take a gander:
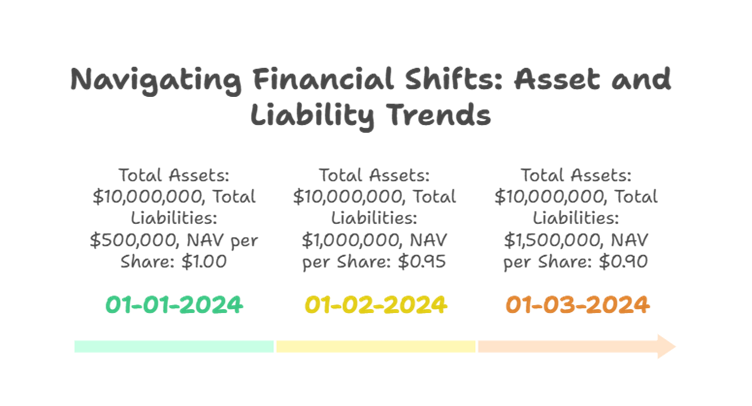
Here, liabilities creep up, dragging the NAV per share down. It's a good reminder to keep those debts in check and thus keep your NAV stronger.
Grabbing hold of how securities valuation and liabilities sway your NAV means smarter choices for you. Curious about diving deeper into NAV calculations and what they mean for your investments? Swing by our section on calculating NAV.
Pricing Mechanisms for Funds
Alright, let's dive into something that might just make your wallet happier: understanding pricing when you're dipping your toes into the world of fund investments. Keeping an eye on these details can really help to stretch those hard-earned pounds. Now, let's have a good chat about purchase and redemption fees, just the essentials.
Purchase Fees
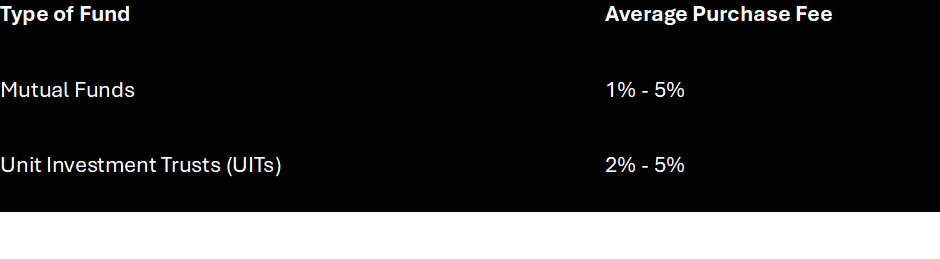
Purchase fees, or as some call them, sales loads, are what you pay upfront when buying shares in a fund. Consider it a little thank you to brokers and advisors for their wisdom. These fees can be a bit of a mixed bag and depend on what type of fund you’re getting into and how big a splash you're making.
Here's a little something to chew on: fees like these get tacked on top of the NAV to figure out what you’re really shelling out per share. Suppose a mutual fund has a NAV of £100 and a cheeky 3% purchase fee. You’d actually be parting with £103 per share.
When you’re out there looking for funds that'll give your income a nice boost, keep those eyes peeled for the fees. They can nibble away at your returns. Look around for options with lower fees or even those that skip the load altogether.
Redemption Fees
Now, onto the redemption fees, which are basically what you pay when you cash out. Calls to mind a little reminder of the costs the fund takes on managing your shares — this one's like a farewell gift to your investment.
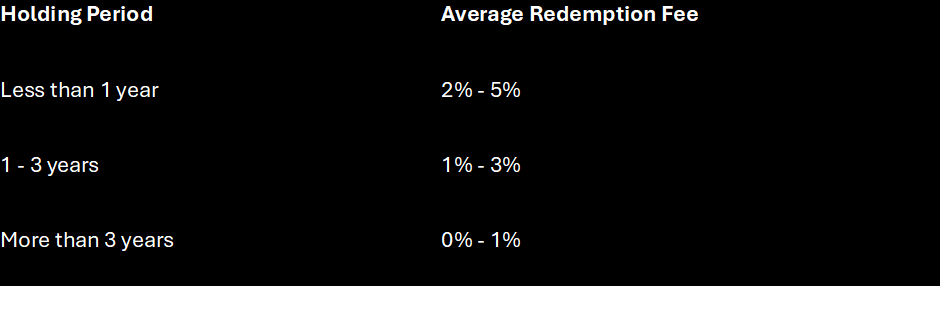
Picture this: you’re selling shares with an NAV of $100, and the fund hits you with a 2% redemption fee. You’ll end up with $98 per share in your pocket.
If you’re thinking of a short stint in the investment game, redemption fees are definitely something you want to get your head around. Plan to hang onto it for a good while? You might find those fees dwindling or even disappearing, so make sure your game plan matches the fee landscape.
Figuring out these nitty-gritty fee details can save you cash and boost those returns. For a bit more on using NAV to your advantage, take a gander at our articles on NAV (net asset value) and cash flow management. They’re packed with the know-how to help you squeeze the most from your investments!
Making the Most of NAV for Bigger Investment Returns

Getting the lowdown on the Net Asset Value (NAV) isn't just about keeping up—it's about boosting those investment returns like a boss. Let's check out some smooth moves and ideas.
Strategies for Working the NAV System
Grabbing hold of what NAV can do will put you in a good spot to make smart choices and pump up your earnings. Here’s how I look at it:
- Spot Those Pricing Wobbles: There are times when stock-exchange-listed closed-end funds and ETFs don't line up—there’s a gap between their market values and NAV. Clever folks can spot these gaps to nab undervalued shares or sell pricey ones. Check out the scoop on market value quirks in MSTY ETF.
- Keep an Eye on Daily NAV: Mutual funds figure out their per-share NAV each day using the closing prices of their portfolio's stocks (Investopedia). Keeping tabs on these figures helps play the market better, timing buys and sells just right.
- Line Up NAV with Market Price: For closed-end funds, checking the NAV against market share price can show if a fund's worth is on point or off the mark. This little trick can uncover juicy investment opportunities.
- Regular Tweak and Balance: Giving your portfolio a regular shake-up based on NAV keeps your investments locked on your financial goals.
Boosting Returns Using NAV
Using smart NAV tactics can put extra muscle behind your investment cash. Here’s my play-by-play:
- Score from Daily NAV Numbers: By getting into the nitty-gritty of daily per-share NAVs, you can test strategies to up a fund’s game. Snapping up shares when NAV is dipping and offloading when it's sky-high can rake in more dough (Investopedia). Scope out income-boosting techniques for more handy hints.
- Ride the High-Growth Wave: High-growth companies might be priced above their NAV, setting the stage for high returns. Dive into equity income strategies for picking out the real winners.
- NAV-Inspired Decisions: Sync your investment decisions with NAV for maximum bang for your buck. Picking funds that consistently climb in NAV might just lead to sweeter returns over time.
- Dodging Pricey Picks: By linking up NAV and market prices, you can steer clear of steep investments. This stop lets you pay just what the shares are actually worth.
- Mixing Up for NAV Wins: Spreading investments across funds with varied NAV ups and downs curbs risk and ups return potential. Check actively managed ETFs to see some nifty dynamic strategies.
- Max Out on Dividends with DRIPs: Pumping dividend returns into more shares based on the NAV fleshes out your earnings nicely. Explore dividend reinvestment plans (drips) for more insight.
Being clued-up on using NAV means more cash in your pocket. With the right tactics and regular NAV checks, I can tune-up my portfolio for the best results.
Cheers,
Stevo – Armchair Banker MAppFin, AdvDipFP, ADA
‘Meet Stevo, the financial wizard behind Armchair Banker. With 15 years of experience in investment banking, corporate finance, and markets, Stevo’s résumé is so impressive it could intimidate a spreadsheet.’
For more ‘Ah-ha’ money and finance guides visit www.armchairbanker.com and subscribe to our newsletter
Follow us on socials
X - https://x.com/armchairbankr
Facebook - https://www.facebook.com/armchairbanker
Medium - https://armchairbanker.medium.com/
Full Disclosure: Stevo may or may not hold this asset at the time of publishing. Using my provided links/affiliate links could result in a payment or fee discount for Stevo, helps keep the lights and refill his whiskey on the rocks mate.
DISCLAIMER: The information in this article does not constitute personal financial advice. Consult your adviser or stockbroker prior to making any investment decision.
MORE DISCLAIMERS: Stevo is not a Financial Adviser, however, works as an Investment Banker assisting ASX listed companies with retail capital raises. All opinions expressed and written by Stevo, including all other ‘Armchair Banker’ contributors is for informational and entertainment purposes only and should not be treated as investment or financial advice of any kind. Any information provided from our articles, blogs and written opinions is general in nature and does not take into account your specific circumstances. Armchair Banker and its contributors are not liable to the reader or any other party, for the reader’s use of, or reliance on, any information received, directly or indirectly, from any content by Armchair Banker in any circumstances.
The reader should always (we’re serious about this):
1. Conduct their own research
2. Never invest more than they are willing to lose
3. Obtain independent legal, financial, taxation and/or other professional advice in respect of any decision made in connection with this video/article.