Navigating the Money Maze: My Insights on NAV (Net Asset Value)


Understanding NAV in Investing
So you're thinking about investing and want to make the most out of it, right? Well, let me tell you, getting a handle on Net Asset Value (NAV) is like finding that golden ticket. Here's my take on NAV - I'll dish out what it means and why crunching those numbers is such a big deal.
Definition of NAV
NAV, short for Net Asset Value, is all about what a fund’s worth once you balance out its assets and debts. This handy equation is like the go-to for anyone dabbling in mutual funds and unit investment trusts. It gives you the rundown on the fund's actual value. The SEC even mandates that mutual funds update their NAV at least once each business day. Keepin’ it real, right?
Breaking it down a bit:
- Assets: This is your jackpot, including things like stocks, bonds, and cash that the fund's got its hands on.
- Liabilities: Think IOUs or short-term loans, the stuff the fund still owes.
Here’s the magic formula to figure out what each fund's packing:
NAV = {Assets} - {Liabilities}
Say, for example:
|
Assets |
Liabilities |
NAV |
|
$1,000,000 |
$200,000 |
$800,000 |
Wanna know the NAV per share? Just chop up that NAV by the number of shares floating around. That’s the ticket price for buying or selling shares of the fund.
Importance of NAV Calculation
Getting a grip on NAV? That’s your ace in the hole for being a savvy investor. Here's why I think it’s a real game-changer:
- Pricing and Valuation: NAV is your compass for the price per unit of a mutual fund. This is the fair deal at which folks buy and sell fund units. It lays everything out nice and clear, helping investors cut through the noise and make better moves.
- Performance Measurement: Watch how NAV moves to size up the fund’s chops. Glide through different time frames to suss out how slick the fund managers are at juggling assets and debts.
- Market Dynamics: Keep your finger on the pulse of market flux with NAV. Since it’s updated daily, it gives you the no-BS value of what's under the hood, which makes it a solid indicator of the fund's heft.
- Premiums and Discounts: NAV clues you up on how a fund’s trading against its real worth. Some might haggle higher or lower than the NAV, affecting whether you swipe right for a trade. .
Knowing the ins and outs of NAV is like having a roadmap to evaluate all sorts of funds - mutual, closed-end, you name it. It’s like your secret weapon for pumping up those income strategies and making some killer investment calls.
NAV vs Market Price
Alright, let's have a chat about investments—without all the jargon. You've probably bumped into words like NAV (Net Asset Value) and market price. They're pretty much like the Batman and Robin of finance terms you need to know to keep your cash stack healthy, especially if you’re chasing those sweet income strategies.
Premiums and Discounts
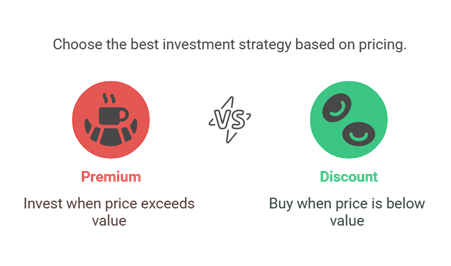
Now, imagine you grabbed a coffee that's priced higher than it’s worth because there’s a latte art competition there or something. That’s a premium. But if they’re trying to clear out yesterday’s doughnuts and give you a discount, you're getting a bargain. Investments have the same vibe:
- Premium: It's when your investment's price tag is glossier than its NAV.
- Discount: Flip it, and you’ve got the price lower than NAV.
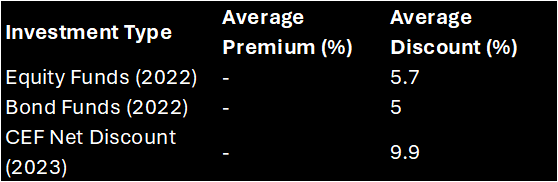
Take 2022, for example. Closed-end funds (CEFs) were doing somersaults with their prices. Equity funds had this average discount of 5.7%, and bond funds weren’t far behind with 5.0% (Investopedia). Basically, the market price was hanging out below NAV, giving investors something to chew on.
Quick glance at the figures:
Take the Guggenheim Strategic Opportunities Fund (GOF), strolling around with a hefty 20.93% premium (Investopedia). This just screams "Investors here believe there's a pot of gold at the end of this fund’s rainbow."
And here's a thing to remember—ideally, over time, the share price and NAV should become best buds and hang out in the same range. But, more than 80% of CEFs haven't been playing by that rule, lounging at discounts instead (Investopedia).
Factors Influencing Market Price
Wondering why prices act like drama queens? Several things can shake, stir, or steady the market price:
- Investor Buzz: Raise your hand if you've let news headlines sway you. Good news might boost the price, while bad news can drop it.
- Supply and Demand: A kettle of investors can boil over prices above NAV, while indifference can bring it down.
- Star Management: Seasoned fund managers? Their credibility can lead to premiums.
- Payout Promises: Funds flaunting attractive monthly income or dividend yields grab attention, leading to higher prices.
- Market Roller Coaster: Prices can tumble if investors spot danger on the horizon.
Here’s a quick rundown of mood-setters for market price:
- Economic seesaws
- Interest rate dances
- Market mood swings
- Management shuffles
- The broad playing field
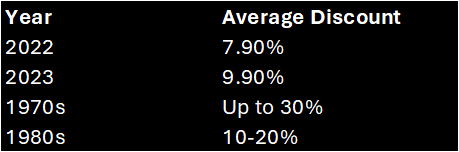
In 2023, prices lounged at an average 9.9% discount compared to the 7.9% the year before (Investopedia). Clearly, the market’s mood swings can make or break an investment's appeal.
By getting a grip on what drives market prices, I can make better decisions about where to park my cash for generating income. Whether it's with dividend reinvestment plans (DRIPs) or a covered-call ETF, knowing how NAV and market price tango can help me time my buys and sells better.
Calculating Net Asset Value
If you want to see your money grow, figuring out the net asset value (NAV) of your fund is a must. In simple terms, NAV is the leftover value after subtracting what a fund owes from what it owns. Let me walk you through it without getting bogged down in complex terms.
Assets and Liabilities
Step one is getting a handle on what your fund owns and owes. According to the trusty folks at Investopedia, assets are things like stocks and cash, while liabilities are debts and bills the fund has to settle.
Example:
Here’s a pretend example of a mutual fund’s numbers to see how it’s done:
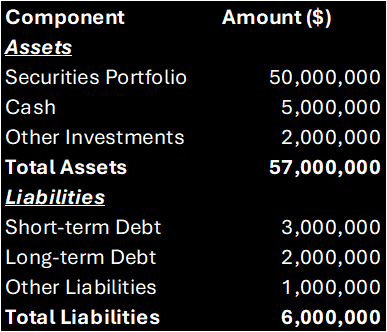
So, this make-believe fund has assets adding up to $57,000,000 and liabilities totalling $6,000,000.
Per-Share NAV Calculation
Nailing down the value for each share is a breeze:
NAV = {Total Assets} - {Total Liabilities} divided by {Number of Outstanding Shares}
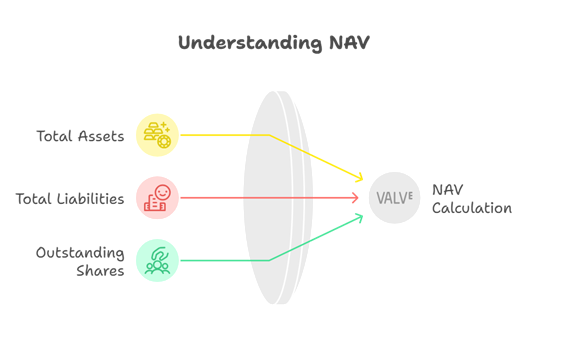
This formula breaks down the worth of each fund share. Let’s stick with our earlier example, supposing the fund has 10,000,000 shares floating around.
Step-by-Step Calculation:
- Calculate Net Assets:
{Net Assets} = $57,000,000 - $6,000,000 = $51,000,000]
- Determine Per-Share NAV:
{Per-Share NAV} = {$51,000,000} divided by {10,000,000 shares} = $5.10]
There you have it: each share in this fund is priced at $5.10. Knowing this gives investors a clearer picture of their money’s performance, helping to decide when to jump in or out (Appreciate Wealth).
Grasping NAV is key for different investment strategies. It comes into play whether you’re focused on making a steady income, diving into dividend reinvestment plans (drips), or looking at equity income strategies. For more on NAV and how it ties into mutual funds and ETFs, pop over to find out about msty etf nav vs market price discrepancies or compare weekly dividend ETFs versus monthly ones.
NAV in Mutual Funds
Daily Calculation Process
Getting your head around how net asset value pops up every day is key for any investor. I'm knee-deep in the investing game, and let me tell ya, mutual funds have to figure their NAV out at least once every workday. This usually happens when the trading day is done and dusted, to nab the most spot-on value of what the fund holds and owes.
To crack this daily puzzle, you grab the whole value of the fund's goodies and lop off the IOUs. What you're left with is the fund’s net worth. Then, just divide this by the number of shares folks have bought to pin down the NAV per share. Investors need this info to keep their finger on the pulse of their stash.
Here's the lowdown:
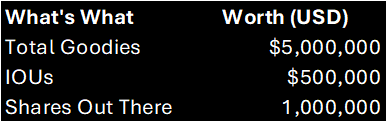
NAV = (Total Goodies - IOUs) / Shares Out There
NAV = ($5,000,000 - $500,000) / 1,000,000 = $4.50 per share
This per-share NAV gives you a crystal-clear idea of the fund’s worth in assets, which is gold when plotting your investment moves.
Impact of Market Fluctuations
Those pesky market ups and downs are like a rollercoaster ride for a mutual fund’s net asset value. Daily shakes in the market can pump up or shrink the value of what the fund’s holding, tweaking the NAV. If stocks get a boost, funds heavy on equities see their NAV tick upwards. If not, well, you get the drift.
From where I stand as an investor, I’ve clocked that market jitters can sometimes throw the NAV and the fund’s market price out of sync, especially when assets trade while you’re catching Z’s. These quirks can either be hurdles or golden chances to play your cards right.
To paint a clearer picture:
|
Day |
Asset Value (USD) |
Liabilities (USD) |
NAV per Share (USD) |
|
Day 1 |
$5,000,000 |
$500,000 |
$4.50 |
|
Day 2 |
$5,200,000 |
$500,000 |
$4.70 |
|
Day 3 |
$4,800,000 |
$500,000 |
$4.30 |
These wiggles show why you shouldn't hang your hat on just one day's NAV when picking your investments. Think longer spans and weigh in other metrics, like how the fund’s measures up against its benchmark.
For sharp cash flow handling and gauging the risk in high-stake bets, knowing the NAV seesaws is super handy. By watching these NAV ticks and the swirling factors, you can make savvier calls for your portfolio and maybe boost your cash predictability.
If you want more tips on steering through these waters, check out our pieces on monthly income and option strategies.
NAV in Closed-End Funds
CEFs and NAV Convergence
Alright mate, let's break this down! We’re talking about Closed-End Funds, or CEFs, where graspin’ the idea of NAV (Net Asset Value) is pretty dang important. Believe it or not, even though they should get all buddy-buddy over time, the share price and the NAV of CEFs often chill out at different spots. In fact, over 80% of CEFs have been hangin' out at a discount compared to their NAV lately, kind of like being the cool kids in the corner (Investopedia).
Now, flip through the pages of 2023. CEFs were trading at an average 9.9% discount to their NAV, a bit fatter than the 7.9% discount we saw in the previous year. Jump back to the '70s, and those discounts were groovier, sometimes hittin’ up to 30%, with the '80s sportin’ discounts between 10%-20% (Investopedia). These recurring discounts do give the efficient market hypothesis a bit of a headache because, well, identical risk-return profiles should, in theory, be matched up with similar price tags.
For investors looking to rake in some investment dough, catching on to these price swings is pretty key. When yonder discounts swell up beyond their typical size, it might just be the go-time to snag a bargain, while ever-persistent premiums might whisper that things are a tad pricey.
Benefits and Challenges of CEFs
Benefits
- Income Generation: One delightful perk of CEFs is the potential for haulin’ in some income. These funds do nifty tricks with leverage to boost returns, making them appealing for those out for a paycheck from investments.
- Diverse Portfolios: CEFs give you a smorgasbord of investments, including stocks, bonds, and other alternative assets, which spreads your risk like peanut butter on toast.
- Potential for Discounts: Thanks to their quirky trading habits, CEFs often sell at discounts, which means you might bag a bargain if things balance out later.
Challenges
- Price Volatility and Discrepancies: The market price of CEFs feels like a runaway roller coaster compared to its NAV. This gap can leave investors scratching their noggins about true value (Investopedia).
- Leverage Risks: Lots have leverage which can jack up returns but also turn those gains upside down if the market sputters. This is like walking on tightrope.
- Liquidity Concerns: Unlike open-ended funds that trade like hotcakes, CEFs get their game on secondary markets, which could make cashin’ out tricky when the market throws a tantrum (Investopedia).
Getting to grips with these ups and downs can shape up your investing approach. If you’re aiming for monthly pay-outs from investments, the right CEFs might just add some zing to your portfolio.
For more juice on income-focused tactics, you might want to check out covered-call ETFs or various actively managed ETFs tuned for steady income. Each of these has its own quirks, needing a good ol' once-over to see how they fit into your grand scheme of things.
Evaluating Investment Performance
NAV Comparison for Fund Performance

So, you're stuck in the endless game of investment Monopoly, trying to suss out the winners from the laggards. Nothing screams "potential" louder than checking out how a fund's net asset value (NAV) morphs over time. Seems a bit like checking your thermometer to see if you're cooking an egg or a disaster, right? I love keeping an eye on these NAV shifts to get a feel for a fund's pulse.
Imagine this: Fund A kicks off at $10 and skyrockets to $20. Meanwhile, Fund B goes from $10 to $15. It’s like watching a tortoise race a jet. Right now, Fund A is doing a happy dance with a whopping 100% gain. Fund B, though, manages a solid but less dazzling 50% increase. The numbers might seem dull, but understanding ‘em? Now that’s gold dust.
Figuring out NAV isn’t rocket science; just add up everything the fund holds, shave off the debts, and spread it over the number of shares floating about. Voilà! You’ve got the per-share price, which is a handy yardstick when deciding your next move.
Here’s a little table showing the NAV tango:

See that? Fund A's clearly the rockstar here.
Beyond NAV: Additional Considerations
While NAV's your trusty ladle for the investment stew, don't get all one-dimensional. There's way more to figure out if a fund's really hitting the high notes. Let's spice things up with some other vital bits:
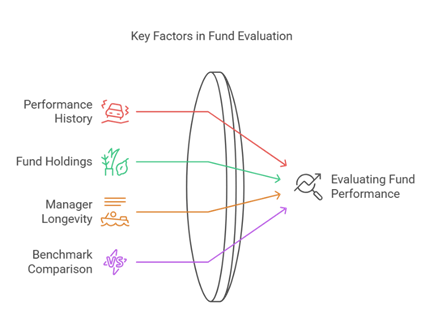
- Performance History: Like a classic car, seeing a fund’s past in action over the years shows its true colours. Did it keep ticking during those market thunderstorms? That history book can whisper secrets of long-term spark.
- Fund Holdings: Ever tried a mystery smoothie? Looking inside a fund's basket is like that. See if they’re vibing with the tech scene or chilling with blue-chip stocks. How they invest can totally shift their performance rhythm.
- Fund Manager Longevity: People don’t realise it, but the captain of the ship—aka the fund manager—counts for plenty. An old sea hand rides out market tempests better than a rookie.
- Benchmark Comparison: Size matters, or at least it does when you pit a fund against benchmarks like the S&P 500 Index. If a fund keeps beating that Goliath, you might just have a winner on your hands.
Diving deeper, you should peek into dividend yields and monthly income tactics for a textured view of fund performance. Explore different investment ventures and income-generating strategies to fit snugly with your financial dreams. This understanding can boost your investment game far beyond just tracking NAV.
Cheers,
Stevo – Armchair Banker MAppFin, AdvDipFP, ADA
‘Meet Stevo, the financial wizard behind Armchair Banker. With 15 years of experience in investment banking, corporate finance, and markets, Stevo’s résumé is so impressive it could intimidate a spreadsheet.’
For more ‘Ah-ha’ money and finance guides visit www.armchairbanker.com and subscribe to our newsletter
Follow us on socials
X - https://x.com/armchairbankr
Facebook - https://www.facebook.com/armchairbanker
Medium - https://armchairbanker.medium.com/
Full Disclosure: Stevo may or may not hold this asset at the time of publishing. Using my provided links/affiliate links could result in a payment or fee discount for Stevo, helps keep the lights and refill his whiskey on the rocks mate.
DISCLAIMER: The information in this article does not constitute personal financial advice. Consult your adviser or stockbroker prior to making any investment decision.
MORE DISCLAIMERS: Stevo is not a Financial Adviser, however, works as an Investment Banker assisting ASX listed companies with retail capital raises. All opinions expressed and written by Stevo, including all other ‘Armchair Banker’ contributors is for informational and entertainment purposes only and should not be treated as investment or financial advice of any kind. Any information provided from our articles, blogs and written opinions is general in nature and does not take into account your specific circumstances. Armchair Banker and its contributors are not liable to the reader or any other party, for the reader’s use of, or reliance on, any information received, directly or indirectly, from any content by Armchair Banker in any circumstances.
The reader should always (we’re serious about this):
1. Conduct their own research
2. Never invest more than they are willing to lose
3. Obtain independent legal, financial, taxation and/or other professional advice in respect of any decision made in connection with this video/article.